LUMI pre-hackathon training - May 2025
Environment for LUMI
module load CrayEnv
module load buildtools/24.03

module load PrgEnv-cray/8.5.0
module load cce/17.0.1
module load craype-accel-amd-gfx90a
module load craype-x86-trento
module load cray-python

module use /pfs/lustrep3/scratch/project_462000394/amd-sw/modules

module load rocm/6.0.3 omnitrace/1.12.0-rocm6.0.x omniperf/2.1.0
export SALLOC_ACCOUNT=project_<your porject ID>
export SBATCH_ACCOUNT=project_<your porject ID>
Rocprof
Setup allocation
salloc -N 1 --gpus=8 -p standard-g --exclusive -t 20:00 --reservation <reservation name>
HIPIFY exercises
git clone https://github.com/amd/HPCTrainingExamples.git
cd HPCTrainingExamples/HIPIFY/mini-nbody/hip/
Compile and run one case. We are on the front-end node, so we have two ways to compile for the GPU that we want to run on.
- The first is to explicitly set the GPU archicture when compiling (We are effectively cross-compiling for a GPU that is present where we are compiling).
hipcc -I../ -DSHMOO --offload-arch=gfx90a nbody-orig.hip -o nbody-orig - The other option is to compile on the compute node where the compiler will auto-detect which GPU is present. Note that the autodetection may fail if you do not have all the GPUs (depending on the ROCm version). If that occurs, you will need to set
export ROCM_GPU=gfx90a.
srun hipcc -I../ -DSHMOO nbody-orig.cpp -o nbody-orig
Now Run rocprof on nbody-orig to obtain hotspots list
srun rocprof --stats nbody-orig 65536
cat results.csv
cat results.stats.csv
--basenames on will show only kernel names without their parameters.
srun rocprof --stats --basenames on nbody-orig 65536
cat results.stats.csv
--hip-trace
srun rocprof --stats --hip-trace nbody-orig 65536
results.hip_stats.csv
cat results.hip_stats.csv
--hsa-trace
srun rocprof --stats --hip-trace --hsa-trace nbody-orig 65536
results.hsa_stats.csv
cat results.hsa_stats.csv
results.json
scp -i <HOME_DIRECTORY>/.ssh/<public ssh key file> <username>@lumi.csc.fi:<path_to_file>/results.json results.json
You could open a browser and go to https://ui.perfetto.dev/ to load the latest version of the tool but we recomment using an older version that is known to work well with traces generated by rocprof. For that, make sure you start a session to connect to LUMI as:
ssh -i <HOME_DIRECTORY>/.ssh/<public ssh key file> <username>@lumi-uan02.csc.fi -L10000:uan02:10000
Alternatively you can run perfetto on your laptop if you have a Docker installed with:
docker run -it --rm -p 10000:10000 --name myperfetto sfantao/perfetto4rocm
Click on Open trace file in the top left corner.
Navigate to the results.json you just downloaded.
Use the keystrokes W,A,S,D to zoom in and move right and left in the GUI
Navigation
w/s Zoom in/out
a/d Pan left/right
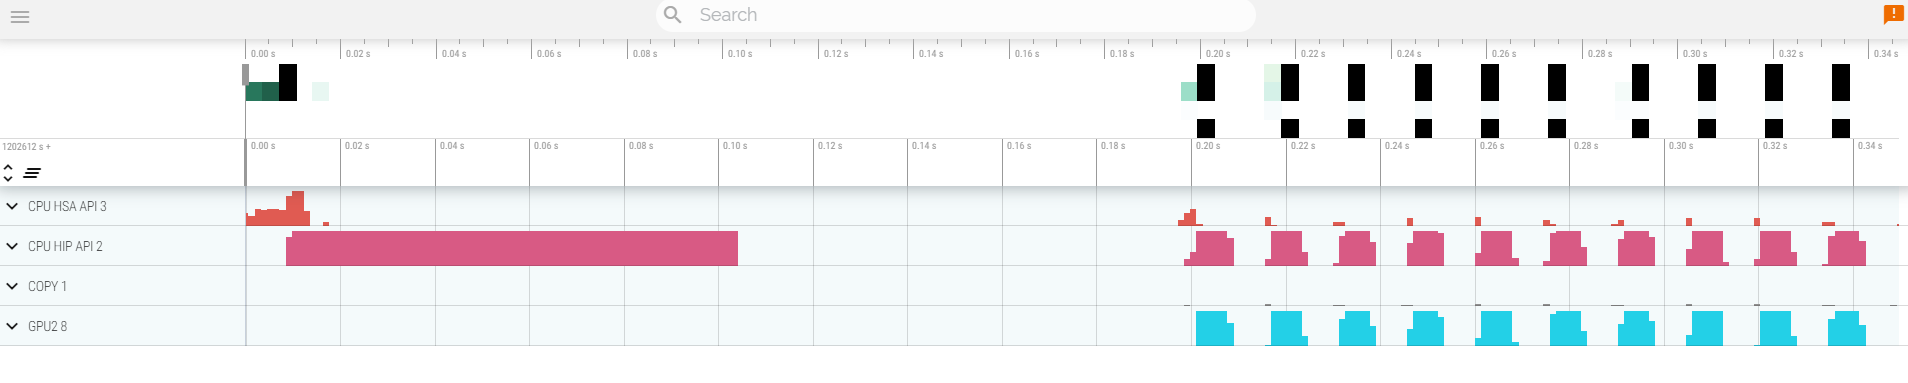
Your trace should look like:
Read about hardware counters available for the GPU on this system (look for gfx90a section)
less $ROCM_PATH/lib/rocprofiler/gfx_metrics.xml
rocprof_counters.txt file with the counters you would like to collect
vi rocprof_counters.txt
rocprof_counters.txt:
pmc : Wavefronts VALUInsts
pmc : SALUInsts SFetchInsts GDSInsts
pmc : MemUnitBusy ALUStalledByLDS
srun rocprof --timestamp on -i rocprof_counters.txt nbody-orig 65536
rocprof runs 3 passes, one for each set of counters we have in that file.
Contents of rocprof_counters.csv
cat rocprof_counters.csv
Omnitrace
-
Load Omnitrace Omnitrace can be loaded with:
module use /pfs/lustrep3/scratch/project_462000394/amd-sw/modules module load rocm/6.0.3 omnitrace/1.12.0-rocm6.0.x -
Check the various options and their values and also a second command for description
srun -n 1 --gpus 1 omnitrace-avail --categories omnitrace
srun -n 1 --gpus 1 omnitrace-avail --categories omnitrace --brief --description
- Create an Omnitrace configuration file with description per option
srun -n 1 omnitrace-avail -G ~/.omnitrace.cfg --all
- Declare to use this configuration file:
export OMNITRACE_CONFIG_FILE=~/.omnitrace.cfg
This path is the default anyway, so you actullay only need this variable if you prefer omnitrace configuration file to live elsewhere.
-
Compile and execute saxpy
cd HPCTrainingExamples/HIP/saxpyhipcc --offload-arch=gfx90a -O3 -o saxpy saxpy.hiptime srun -n 1 ./saxpy
-
Check the duration
-
Compile and execute Jacobi
cd HPCTrainingExamples/HIP/jacobi
-
Now build the code
nice make -f Makefile.cray -jtime srun -n 1 --gpus 1 Jacobi_hip -g 1 1
-
Check the duration
Dynamic instrumentation
-
Execute dynamic instrumentation:
time srun -n 1 --gpus 1 omnitrace-instrument -- ./Jacobi_hipand check the duration -
About Jacobi example, as the dynamic instrumentation would take long time, check what the binary calls and gets instrumented:
nm --demangle Jacobi_hip | egrep -i ' (t|u) ' -
Available functions to instrument:
srun -n 1 --gpus 1 omnitrace-instrument -v 1 --simulate --print-available functions -- ./Jacobi_hip -g 1 1- the simulate option means that it will not execute the binary. This will still take some time.
Binary rewriting (to be used with MPI codes and decreases overhead)
-
Binary rewriting available functions:
srun -n 1 --gpus 1 omnitrace-instrument -v -1 --print-available functions -o jacobi.inst -- ./Jacobi_hip -
Binary rewriting:
srun -n 1 --gpus 1 omnitrace-instrument -o jacobi.inst -I Jacobi_t::Run -- ./Jacobi_hip- We created a new instrumented binary called jacobi.inst
-
Confirm we instrumented our user function
Jacobi_t::Run:cat omnitrace-jacobi.inst-output/TIMESTAMP/instrumentation/instrumented.txt -
Let's enable collection of numeric profilling data. Edit
~/.omnitrace.cfgto include:OMNITRACE_PROFILE = true -
Executing the new instrumented binary:
time srun -n 1 --gpus 1 omnitrace-run -- ./jacobi.inst -g 1 1and check the duration -
See the list of the instrumented GPU calls:
cat omnitrace-jacobi.inst-output/TIMESTAMP/roctracer.txt
Visualization
- Copy the
omnitrace-jacobi.inst-output/TIMESTAMP/perfetto-trace-0.prototo your laptop, open the web page https://ui.perfetto.dev/ click to open the trace and select the file
Hardware counters
q
* See a list of all the counters: srun -n 1 --gpus 1 omnitrace-avail --all
* Declare in your configuration file: OMNITRACE_ROCM_EVENTS = GPUBusy,Wavefronts
* Execute: srun -n 1 --gpus 1 omnitrace-run -- ./jacobi.inst -g 1 1 and copy the perfetto file and visualize
Sampling
Activate in your configuration file OMNITRACE_USE_SAMPLING = true and OMNITRACE_SAMPLING_FREQ = 100, execute and visualize
This will sample the callstack which you can see in the bottom of your profile.
Kernel timings
- Open the file
omnitrace-binary-output/timestamp/wall_clock.txt(replace binary and timestamp with your information) - In order to see the combined kernel timmings gathered in your configuration file, make sure that
OMNITRACE_PROFILE = trueandOMNITRACE_FLAT_PROFILE = true, execute the code and open again the fileomnitrace-jacobi.inst-output/TIMESTAMP/wall_clock.txt
Omniperf
-
Reserve a GPU, compile the exercise and execute Omniperf, observe how many times the code is executed
-
Let's build a double-precision general matrix multiply example - DGEMM.
cd HPCTrainingExamples/HIP/dgemm/ mkdir build cd build cmake .. nice make -j cd bin srun -n 1 omniperf profile -n dgemm -- ./dgemm -m 8192 -n 8192 -k 8192 -i 1 -r 10 -d 0 -o dgemm.csv -
Run
srun -n 1 --gpus 1 omniperf profile -hto see all the options -
Now is created a workload in the directory workloads with the name dgemm (the argument of the -n). So, we can analyze it
srun -n 1 --gpus 1 omniperf analyze -p workloads/dgemm/MI200/ &> dgemm_analyze.txt
- If you want to only roofline analysis, then execute:
srun -n 1 omniperf profile -n dgemm --roof-only -- ./dgemm -m 8192 -n 8192 -k 8192 -i 1 -r 10 -d 0 -o dgemm.csv
There is no need for srun to analyze but we want to avoid everybody to use the login node. Explore the file dgemm_analyze.txt
- We can select specific IP Blocks, like:
srun -n 1 --gpus 1 omniperf analyze -p workloads/dgemm/MI200/ -b 7.1.2
But you need to know the code of the IP Block
- If you have installed Omniperf on your laptop (no ROCm required for analysis) then you can download the data and execute:
omniperf analyze -p workloads/dgemm/MI200/ --gui
- Open the web page: http://IP:8050/ The IP will be displayed in the output